A data pipeline moves data from where it’s generated to where it’s needed. Along the way, it can transform, filter, enrich, aggregate, or route that data to one or more destinations.
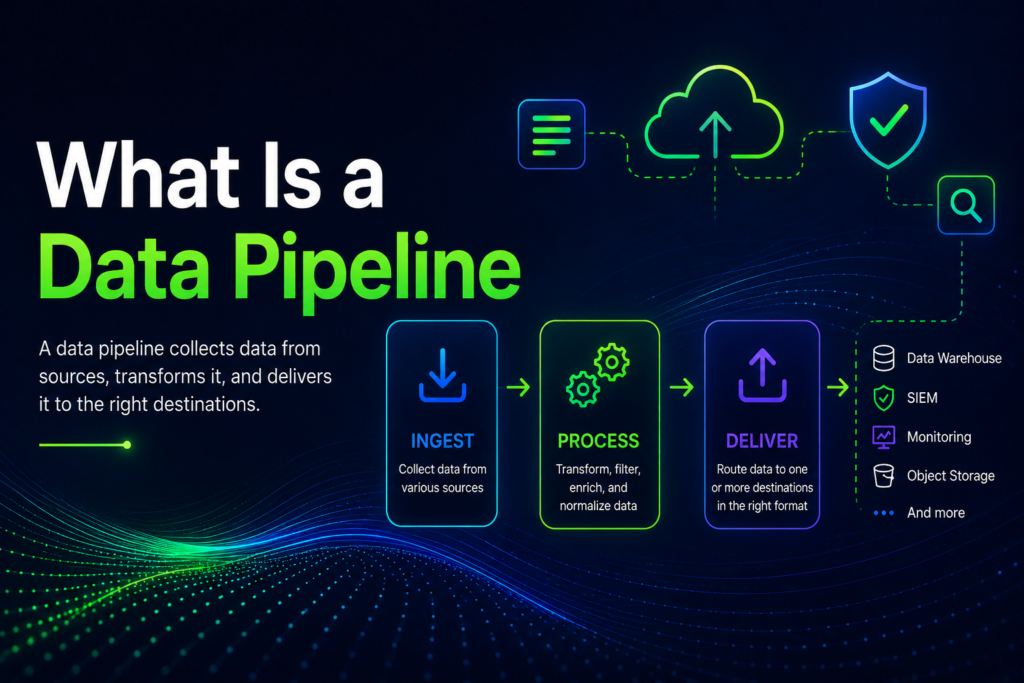
Because it’s a broad concept, the term data pipeline covers many different architectures. It might refer to an ETL workflow that loads business data into a warehouse, a streaming platform processing IoT events in real time, or an observability pipeline collecting logs and metrics for security and monitoring tools. Regardless of the use case, every data pipeline follows the same basic pattern: ingest, process, deliver.
The Basic Structure of a Data Pipeline
Every data pipeline consists of three core stages.
Ingestion brings data into the pipeline. Sources include databases, APIs, message queues, log files, cloud services, network devices, and application events. The ingestion layer must handle different protocols, formats, and data volumes while maintaining reliable delivery.
Processing transforms the data into a format that’s easier to consume. Depending on the use case, this may involve parsing raw records, filtering unnecessary events, normalizing inconsistent formats, enriching data with additional context, or aggregating records to reduce volume.
Delivery forwards processed data to its destination. That could be a data warehouse, a SIEM, a monitoring platform, object storage, or several systems at once. Routing rules determine which data goes where and in what format.
Common Data Pipeline Examples
ETL pipelines (Extract, Transform, Load) are the traditional approach for moving structured business data. They extract information from operational systems, transform it into the required schema, and load it into a data warehouse or data lake. Technologies such as Apache Spark, dbt, and Fivetran are commonly used for these workloads.
Streaming pipelines process events continuously as they arrive instead of waiting for scheduled batches. They’re widely used for financial transactions, clickstream analytics, IoT telemetry, and real-time alerting, where even small delays matter. Apache Kafka and Apache Flink are among the best-known streaming platforms.
Log pipelines collect logs from servers, applications, cloud platforms, and network devices before parsing, filtering, and normalizing them for downstream analysis. They’re often referred to as observability pipelines or telemetry pipelines, especially when they also handle metrics and traces.
ML feature pipelines prepare data for machine learning by cleaning datasets, generating features, and delivering consistent inputs to training and inference systems.
What Is an Observability Pipeline?
An observability pipeline is a specialized data pipeline designed for telemetry data—logs, metrics, and traces. Its role is to collect information from across your infrastructure, normalize and enrich it, reduce unnecessary volume, and route it to the tools that need it, whether that’s a SIEM, a monitoring platform, long-term storage, or all of them simultaneously.
It sits between your infrastructure and your observability tools. Without an observability pipeline, every destination often requires its own agent or collector, data formats become inconsistent across systems, and even simple routing changes can mean reconfiguring dozens of sources. Centralizing ingestion and processing removes much of that operational overhead.
Building and maintaining an observability pipeline, however, isn’t trivial. Log sources produce data in many different formats (Syslog, JSON, CEF, GELF, plain text, and others) while downstream tools often expect completely different schemas. Keeping parsers, transformations, and routing rules up to date as infrastructure evolves quickly becomes an ongoing operational burden.
How Logproxy Handles Data Pipelines
Logproxy is built specifically for observability pipelines. Acting as a vendor-neutral processing layer between data sources and destinations, it handles ingestion, transformation, and routing without requiring custom parsers or manual coding.
Instead of relying on source-specific parsers, Logproxy accepts a wide range of formats out of the box, including Syslog, JSON, CSV, GELF, CEF, LogFmt, Protobuf, OTLP, and plain text. Automatic source discovery helps identify new systems as they appear, making onboarding significantly faster and reducing the need to deploy additional collectors.
Data is processed close to its source rather than at the destination. For example, firewall logs can be parsed, normalized, and filtered before being forwarded, reducing bandwidth usage while ensuring downstream tools receive clean, structured data instead of raw log streams.
Routing is managed from a centralized interface where you define which data is sent to which destination and in what format. Whether logs need to be delivered to a SIEM, metrics to a monitoring platform, or archived in long-term storage, the routing logic is maintained in one place instead of being duplicated across individual systems.
Logproxy also uses infrastructure-based pricing rather than charging by log volume, allowing organizations to scale high-throughput environments without costs increasing alongside every additional event.
Instead of deploying separate collectors for every destination, Logproxy ingests data once, processes it once, and forwards it wherever it’s needed. The result is a simpler architecture, lower operational overhead, and consistent, high-quality telemetry across the entire observability stack.
How to Create a Data Pipeline in Logproxy
Building a data pipeline in most tools means writing parsers, configuring agents on individual systems, and maintaining a set of brittle format mappings that break whenever a source changes its log schema. Logproxy takes a different approach: pipelines are configured through a visual interface, sources are discovered automatically, and transformations are applied without writing code.
This guide walks through how a pipeline is built in Logproxy from source to destination.
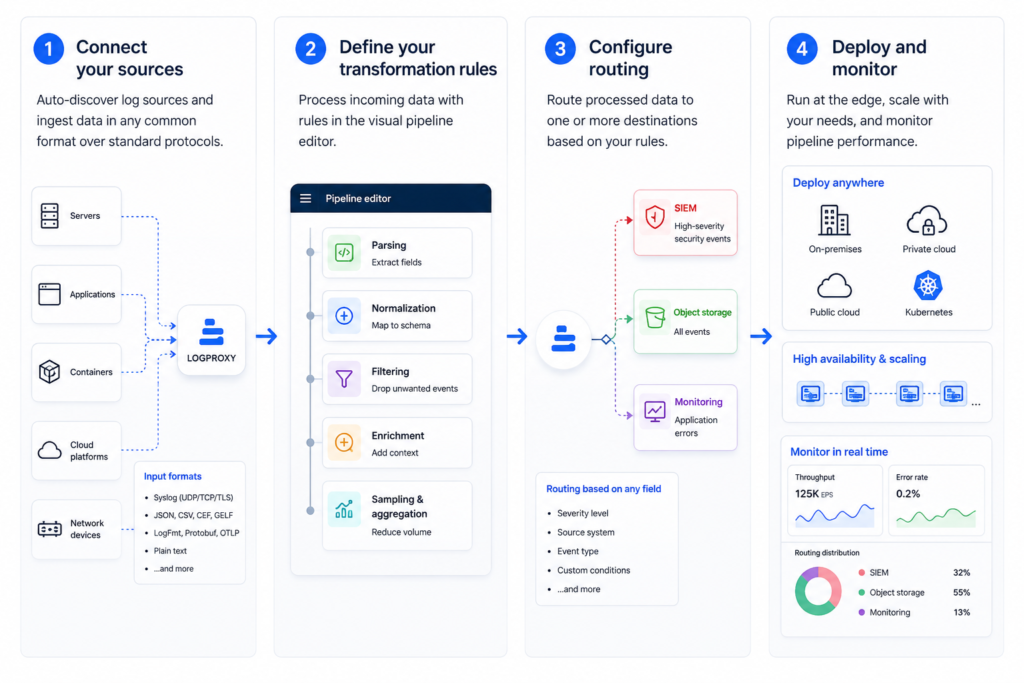
Step 1: Connect your sources
Logproxy uses autodiscovery to identify log sources in your environment, such as servers, applications, containers, cloud platforms, and network devices. Rather than deploying a separate agent for each system, Logproxy’s format-agnostic ingestion layer accepts data in any common format over standard protocols.
Supported input formats include syslog (UDP/TCP/TLS), JSON, CSV, CEF, GELF, LogFmt, Protobuf, OTLP, and plain text. This means most systems can start sending data to Logproxy with no changes to how they generate logs, only the destination address needs to point to Logproxy.
For systems that need explicit onboarding, the interface provides source configuration without requiring custom parsing rules. Logproxy handles the format differences internally.
Step 2: Define your transformation rules
Once data is flowing in, you define how it should be processed. Logproxy provides a visual pipeline editor where transformations are configured as rules applied to incoming data streams.
Common transformation operations include:
Parsing — extracting structured fields from unstructured log messages. Logproxy handles this automatically for known formats. For custom or legacy formats, field extraction rules can be defined in the interface without writing regex from scratch.
Normalization — mapping fields from different sources to a consistent schema. If one source calls it src_ip and another calls it source_address, normalization brings them to a single field name that your destination expects.
Filtering — dropping log events that don’t meet your criteria before they consume destination storage or licensing. Rules can filter on any field: severity level, source system, event type, or custom conditions.
Enrichment — adding fields to log records before delivery. Logproxy supports adding geolocation data, user details, system names, application context, and custom metadata. This means your destination receives data that’s already analysis-ready rather than requiring post-ingestion enrichment.
Sampling and aggregation — reducing volume for high-frequency, low-signal events. Rather than forwarding every repeated occurrence of a routine event, sampling sends a representative subset while still preserving the signal.
Step 3: Configure routing
Routing determines which processed data goes to which destination. Logproxy supports multiple simultaneous destinations, so a single incoming stream can be split: high-severity security events routed to a SIEM, all events forwarded to low-cost object storage, and application errors sent to a monitoring platform.
Routing rules are set per pipeline and can be based on any field in the processed data. This allows cost optimization by sending only relevant data to expensive SIEM storage while keeping full fidelity in cheaper long-term storage.
Output destinations support the same range of formats and protocols as inputs. If a destination expects CEF and your sources produce Syslog, Logproxy handles the conversion without additional tooling.
Step 4: Deploy and monitor
Logproxy processes data at the edge, near the source, before forwarding it. This reduces bandwidth usage between source systems and destinations and ensures that transformation work does not have to be performed on the destination platform.
Deployment options cover on-premises, private cloud, public cloud, Kubernetes, and hybrid environments. Logproxy supports high-availability configurations and horizontal scaling for high-throughput environments.
Once live, data pipeline performance is visible in the management interface: throughput, error rates, and routing distribution. Changes to transformation rules or routing logic take effect without redeploying agents at the source.
Onboard New Resources Effortlessly
The end result is a data pipeline where new sources can be onboarded without deploying new collectors, format changes at the source don’t require parser updates, and routing logic can be adjusted centrally without touching individual systems. For teams managing heterogeneous environments, including a mix of on-premises infrastructure, cloud workloads, and legacy systems, that operational simplicity is the main value.